# Contamination
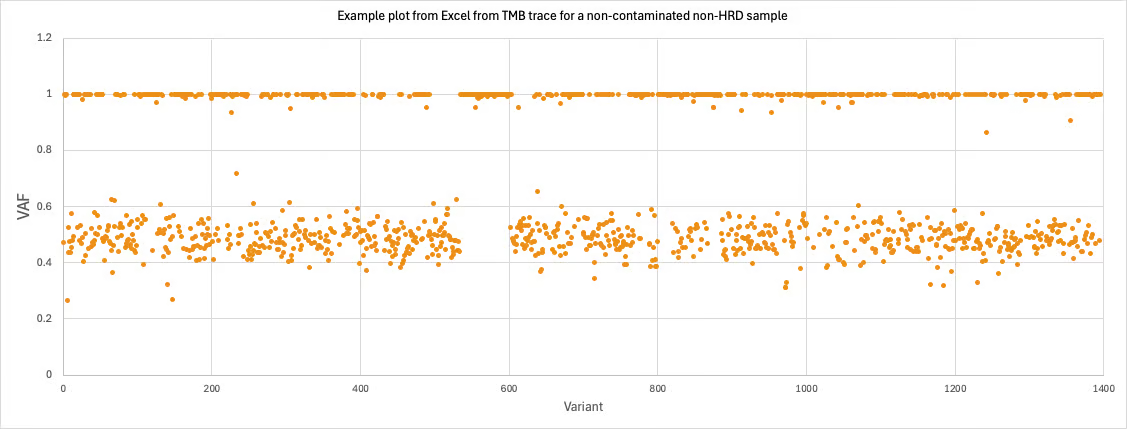
The contamination score evaluates presence of sample-to-sample contamination. The algorithm uses common germline SNPs in the homozygous state expected to have variant allele frequencies (VAF) at 0% and 100%. In contaminated samples, the VAFs shift away from the expected values allowing the detection of sample-to-sample contamination.
{% hint style="success" %}
The contamination score can detect sample-to-sample contamination greater than or equal to 2% (more than 2% of DNA input is coming from the contaminant)
{% endhint %}
### Contamination Score Calculation
The contamination score is calculated using the SNP error file and Pileup file that are generated during the small variant calling, as well as the TMB trace file. The algorithm includes the following steps:
* All positions that overlap with a pre-defined set of common SNPs that have variant allele frequencies of < 25% or > 75% are collected (only SNP are considered, indels are excluded)
* Variants in CNV events are removed using a clustering method
* The likelihood that the positions are an error or a real mutation is calculated by:
* Estimating the error rate per sample
* Counting mutation support
* Counting total depth
* The contamination score is calculated as the sum of all the log likelihood scores across the pre-defined SNP positions whose minor allele frequency is <25% in the sample and not likely due to CNV events:
CONTAMINATION_SCORE = sum(log10(P(vi is False Positive)))
### Contamination Score Interpretation
* The contamination score is output in the metrics output file, `MetricsOutput.tsv`
* If a contamination score is equal or below 1457 (the upper specification limit provided in the "USL Guideline" field in the metrics output file, see [Metrics Output page](https://help.tso500software.illumina.com/dragen-tso-500-ctdna-guides/dragen-tso-500-ctdna-v2.6/analysis-output/metrics-output)), the sample has less than 2% sample-to-sample contamination.
* If a contamination score is above 1457, the sample has more than 2% sample-to-sample contamination. In this case, an estimation of the contamination can be obtained from the PCT\_CONTAMINATION\_EST metric, see more details on the [DNA Expanded Metrics page](https://help.tso500software.illumina.com/dragen-tso-500-ctdna-guides/dragen-tso-500-ctdna-v2.6/analysis-output/metrics-output/dna-expanded-metrics). As noted, PCT\_CONTAMINATION\_EST is not valid unless the contamination score exceeds 1457.
{% hint style="warning" %}
Samples with highly rearranged genomes (HRD samples) can have variants with VAFs that shift away from the expected frequencies due to genomic rearrangement, which can lead to false-positive contamination scores
{% endhint %}
* Visual examination can help determine if a shift of VAFs is due to true contamination
Visual investigation of VAFs across the genome can help determine if a shift of VAFs is due to true contamination
### How to build a VAF plot for visual examination
1. To build a VAF plot, use the `{Sample_ID}.tmb.trace.csv` file. Filter to only germline variants (for example, by using tags "Germline\_DB" and "Germline\_Proxi" in the column "Status") and use values in the VAF column.
2. Select Scatter from the Charts menu
3. Review plot as described above analyzing whether variants are scattered or clustered around 50% and 100% VAF
.png?alt=media)
.png?alt=media)